Enhanced Vegetation Index (EVI): A Modern Approach to Vegetation Health Monitoring
The Enhanced Vegetation Index (EVI) is an advanced remote sensing index designed to measure vegetation health and density. While similar to the well-known Normalized Difference Vegetation Index (NDVI), EVI improves upon certain limitations of NDVI, especially in areas with dense vegetation or atmospheric interference. EVI has become a valuable tool in environmental monitoring, agriculture, and forest management, offering detailed insights into plant health, biomass, and ecosystem dynamics.
The Enhanced Vegetation Index (EVI) is similar to Normalized Difference Vegetation Index (NDVI) and can be used to quantify vegetation greenness. EVI corrects some condition such as atmospheric condition, canopy background noise, and more sensitive in areas with dense vegetation.
What is Enhanced Vegetation Index (EVI)?
EVI is an index that quantifies vegetation greenness and vigor by analyzing the reflectance of specific light wavelengths from plants. Like NDVI, EVI uses data from the visible and near-infrared (NIR) parts of the spectrum. However, EVI also incorporates the blue band, which helps reduce atmospheric interference and enhances sensitivity in densely vegetated areas.
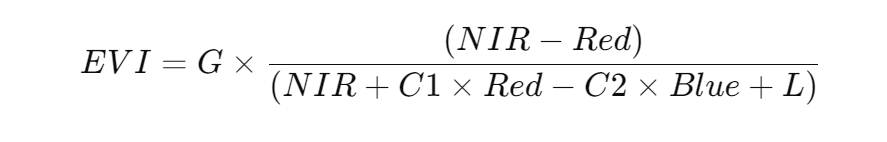
- NIR: Reflectance in the near-infrared band
- Red: Reflectance in the red band
- Blue: Reflectance in the blue band
- G: Gain factor (typically set to 2.5)
- C1 and C2: Coefficients to correct for atmospheric resistance (usually set to 6 and 7.5, respectively)
- L: Canopy background adjustment (often set to 1)
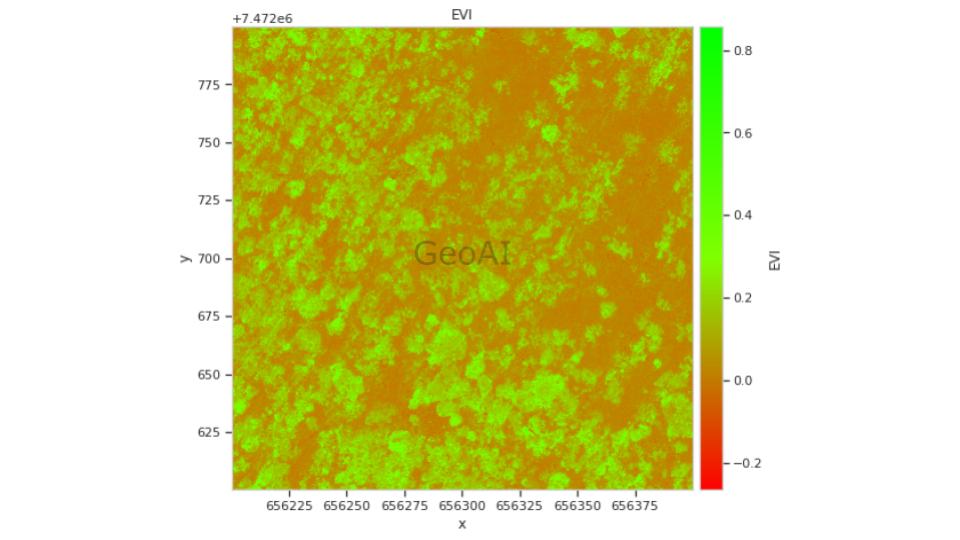
EVI values range from -1 to +1, with higher values indicating healthier, denser vegetation.
What’s the Difference Between NDVI and EVI?
The Enhanced Vegetation Index and the Normalized Difference Vegetation Index are both valuable tools for monitoring vegetation health, but they have some key differences and advantages. NDVI has been widely used for decades and is based on the simple ratio of the red and near-infrared bands of light. While NDVI is effective for many applications, it has some limitations that can affect its accuracy and reliability.
| Feature | NDVI (Normalized Difference Vegetation Index) | EVI (Enhanced Vegetation Index) |
| Formula | (NIR – Red) / (NIR + Red) | G * (NIR – Red) / (NIR + C1 * Red – C2 * Blue + L) |
| Spectral Bands Used | Read and Near0Infrared (NIR) | Red, NIR, Blue |
| Sensitivity to Vegetation | Saturates in dense vegetation | Maintains sensitivity in dense vegetation |
| Atmospheric Resistance | Lower (sensitive to atmospheric distortions) | Higher (corrects for aerosol influences using Blue band) |
| Soil Background Influence | More sensitive to soil brightness | Minimizes soil background noise |
| Cloud & Shadow Impact | More affected | Less affected |
| Best Use Cases | General vegetation monitoring, sparse vegetation | Dense vegetation, tropical forests, high biomass areas |
| Source Imagery | Most satellite platforms (e.g. Sentinel-2, Landsat) | MODIS, Sentinel-2, Landsat with additional bands |
| Limitations | Can overestimate greenness in high-density regions | More complex to compute, needs Blue band availability |
Why Use EVI Over NDVI?
While NDVI is a widely used vegetation index, it has limitations, especially in areas with dense vegetation cover or atmospheric interference. EVI addresses these issues by:
- Reducing Atmospheric Interference: EVI’s use of the blue band helps correct for atmospheric effects such as haze, smoke, and dust, which can distort NDVI readings.
- Improving Sensitivity in Dense Vegetation: NDVI can saturate in regions with dense vegetation, where additional greenness does not significantly increase NDVI values. EVI remains sensitive to changes in canopy density and structure, even in thickly vegetated areas like rainforests.
- Reducing Soil Reflectance Influence: EVI includes a canopy background adjustment factor (L), which minimizes the impact of soil brightness on vegetation measurements. This correction is especially useful in agricultural areas where soil exposure varies.
Applications of Enhanced Vegetation Index
The Enhanced Vegetation Index is widely used across multiple fields:
- Agriculture: EVI helps monitor crop health, growth stages, and yield potential. Farmers and agricultural researchers can use EVI to make informed decisions on irrigation, fertilization, and pest control.
- Forest Monitoring: EVI provides insights into forest canopy density and tree health, making it useful for monitoring forest ecosystems, deforestation, and forest regrowth. By tracking EVI values over time, forest managers can assess the impact of climate change on forest health.
- Climate Studies: Vegetation plays a crucial role in carbon storage and the global carbon cycle. EVI data contributes to climate models, helping scientists understand how vegetation changes respond to climate change and natural events.
- Environmental Conservation: Conservationists use EVI to assess ecosystem health, detect areas of land degradation, and monitor conservation efforts. EVI’s ability to capture subtle vegetation changes makes it an effective tool for evaluating habitat quality.
Technology for EVI Measurement
Modern technology enables the calculation of EVI from various platforms:
- Satellite Imagery: Satellites such as MODIS (Moderate Resolution Imaging Spectroradiometer) on NASA’s Terra and Aqua satellites are equipped to capture the wavelengths needed for EVI calculations. Sentinel-2 from the European Space Agency also provides data for EVI, offering frequent global coverage.
- Drones: Drones equipped with multispectral cameras can capture high-resolution EVI data over specific locations, providing a detailed view of vegetation at a local level. Drones can be used to mount a LiDAR sensor to add more data for EVI and other vegetation monitoring process. Drones are ideal for precision agriculture and monitoring large areas.
- IoT Sensors: The Internet of Things (IoT) has introduced sensor networks that can monitor environmental variables and vegetation health. While not directly calculating EVI, these sensors provide complementary data, such as temperature and humidity, to enrich EVI analyses.
- Deep Learning: Deep learning models can automatically extract relevant features from EVI data, eliminating the need for labor-intensive manual feature engineering. This makes EVI analysis faster, more efficient, and scalable.
GeoAI for EVI Measurement
GeoAI, or Geospatial Artificial Intelligence, combines geographic data with machine learning and AI to derive insights from complex datasets like EVI. Using GeoAI with EVI data opens new possibilities:
- Predictive Modeling: Machine learning models can use EVI data to predict crop yields, forest health changes, or risk of vegetation loss due to extreme weather events.
- Anomaly Detection: GeoAI can identify unusual EVI values that may indicate issues such as drought stress, pest outbreaks, or soil degradation. These insights enable timely intervention.
- Automated Mapping: GeoAI can automate vegetation mapping by analyzing EVI data over large regions, saving time and enhancing accuracy in identifying vegetation patterns.
Future Trends in Vegetation Index Research and Monitoring
One of the key future trends in this field is the development of new and improved vegetation indices. Researchers are exploring ways to enhance existing indices, like EVI, and to develop new indices that can provide even more accurate and detailed information on vegetation health. This includes the use of advanced imaging techniques, such as hyperspectral imaging, and the incorporation of additional environmental variables, such as soil moisture and temperature.
Another important trend is the integration of vegetation indices with other environmental monitoring tools. By combining EVI with data from other sources, such as weather stations, soil sensors, and biodiversity surveys, researchers can gain a more comprehensive understanding of ecosystem health and function. This integrated approach is essential for addressing complex environmental challenges, such as climate change and biodiversity loss, and for developing holistic strategies for ecosystem management and conservation.
The use of artificial intelligence (AI) and machine learning (ML) in vegetation index research and monitoring is also a growing trend. AI and ML algorithms can analyze vast amounts of data and identify patterns and trends that may not be visible with traditional analysis techniques. This can provide valuable insights into vegetation health and productivity and support the development of predictive models for ecosystem management. The integration of AI and ML with vegetation indices like EVI has the potential to revolutionize environmental monitoring and to provide new tools for addressing global environmental challenges.
The Enhanced Vegetation Index (EVI) represents a significant advancement in vegetation monitoring. It offers a more accurate and robust alternative to NDVI, especially in dense and variable environments. By utilizing satellite imagery, drones, and AI technologies, EVI provides critical insights into plant health, aiding in agriculture, forest management, and environmental conservation.
As GeoAI continues to evolve, the integration of EVI data will enhance predictive modeling, anomaly detection, and automated mapping, transforming how we monitor and manage the world’s vegetation.
Category List
- 3D Point Cloud
- Artificial Intelligence
- Asset Management
- Digital Twin
- Featured
- Hardware
- Knowledge Graph
- LiDAR
- News
- Site Monitoring
- Vegetation Monitoring
- Virtual Reality
Recent Post
- Digital Twin Integration for Road Networks Using LiDAR and AI
- Pavement Crack Detection using AI and LiDAR
- Pavement Defect Detection with GeoAI: Harnessing Laser Scanners and Profilers
- Asset Inventory Mapping with GeoAI: Complete Road Asset Capture Using Laser Scanning and Profiling
- Mobile Laser Scanner and Laser Profiler: Dual Approach to Road Surface Condition Surveys
Frequently Asked Question (FAQ)
EVI is a vegetation index designed to improve the limitations of NDVI, especially in areas with dense vegetation. It uses the blue spectral band to correct for atmospheric conditions and minimizes background noise from soil and clouds.
EVI adds the blue band into its calculation, offering better resistance to atmospheric interference and soil background. Unlike NDVI, EVI does not saturate in areas with dense vegetation, making it more suitable for forests or lush crop fields.
Use EVI when analyzing:
Tropical forests or dense canopy cover
High-biomass agricultural fields
Areas prone to cloud cover or smoke
Projects needing more precise vegetation change tracking
EVI can be calculated from:
MODIS (Moderate Resolution Imaging Spectroradiometer)
Landsat 8/9
Sentinel-2 (with all required bands)
Any UAV/drone with red, NIR, and blue bands
Yes, especially in areas like Queensland’s tropical forests, NSW’s coastal zones, or bushland restoration sites, EVI provides a more reliable picture of vegetation health due to its resistance to dust, haze, and soil brightness.
Absolutely. EVI is ideal for time-series analysis, allowing you to monitor seasonal changes, drought impacts, or reforestation progress more accurately than NDVI.