Knowledge Graph Example in Construction Industry
In the rapidly evolving landscape of data-driven technologies, Knowledge Graphs have emerged as powerful tools that organize and connect information, offering a deeper understanding of complex scenarios. This article explores the application of Knowledge Graphs in construction industries including the data and process needed to build the knowledge graph. We will discuss about construction safety, building energy consumption estimation, and traffic sign compliance checking to showcase how Knowledge Graphs are reshaping these domains.
Knowledge Graph for Construction Accidents
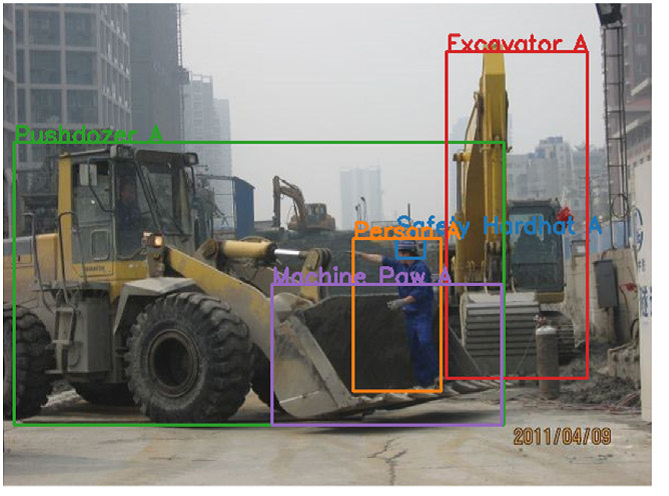
Construction sites are dynamic environments with inherent safety challenges. A Knowledge Graph for Construction Accidents integrates data related to construction sites, incidents, safety protocols, and environmental factors. First of all, potential risk and information related to safety was extracted based on Occupational Safety and Health Administration (OSHA) and previous experience. The data can be report from previous accident data, site information, personnel data, safety protocol, equipment and machinery data. By integrating and interconnecting these diverse datasets, the Knowledge Graph can uncover relationships, patterns, and insights that contribute to a more proactive approach to construction site safety. The goal is to create a comprehensive and real-time understanding of the safety landscape, allowing for informed decision-making and the implementation of preventive measures. For instance, it can correlate accident data with weather conditions, equipment usage, and worker schedules to pinpoint areas requiring heightened safety protocols.
Knowledge Graph for Building Room Energy Consumption Estimation
Managing energy consumption in buildings is crucial for sustainability. A Knowledge Graph for Building Room Energy Consumption Estimation consolidates information on room dimensions, occupancy patterns, and energy usage history. To create the knowledge graph, there are some steps needed:
- Identify Entities and Relationships:
- Define entities such as Room, Occupancy, Appliance, HVAC System, Lighting, and Weather.
- Establish relationships between entities, such as “Room has Appliance,” “Room has HVAC System,” and “Building consumes Energy.”
- Data Integration:
- Gather data from diverse sources and formats.
- Standardize and preprocess data to ensure consistency.
- Create a unified data schema for integration.
- Data Representation:
- Represent data using RDF (Resource Description Framework) or another graph-based data model.
- Use triples to represent relationships between entities (subject-predicate-object).
- Ontology Development:
- Define an ontology that includes classes, properties, and relationships specific to the domain (e.g., building ontology, energy ontology).
- Use standardized ontologies if available (e.g., Brick Schema for building-related data).
- Triplestore Setup:
- Choose a triplestore or graph database to store and query the Knowledge Graph.
- Load the integrated data into the triplestore.
- Query and Analysis:
- Develop queries to extract insights from the Knowledge Graph.
- Analyze relationships and patterns to estimate room energy consumption.
- Visualization:
- Use visualization tools to represent the Knowledge Graph graphically.
- Visualize energy consumption patterns, correlations, and trends.
- Continuous Monitoring and Updating:
- Implement mechanisms for continuous data monitoring and updating.
- Incorporate real-time data to enhance the accuracy of energy consumption estimations.
By establishing relationships between these variables, the graph facilitates accurate predictions of energy consumption. This aids in optimizing HVAC systems, implementing energy-efficient technologies, and ultimately reducing overall energy costs.
Knowledge Graph for Traffic Sign Compliance Checking
Another knowledge graph example in construction is related to traffic. Building a Knowledge Graph for Traffic Sign Compliance Checking involves integrating diverse data related to road infrastructure, traffic regulations, sign placements, and compliance records. Here’s a breakdown of the data needed to create the Knowledge Graph:
1. Road Infrastructure Data
- Geospatial data of road networks, including lanes, intersections, and traffic signals.
- Types and locations of road signs.
- Speed limits and regulatory features.
2. Traffic Regulations
- Comprehensive dataset of traffic regulations and rules.
- Information on specific sign meanings and compliance requirements.
3. Traffic Sign Inventory
- Inventory of all road signs, including type, size, and color.
- Geospatial coordinates of each sign.
- Historical data on sign installations and modifications.
4. Compliance Records
- Records of compliance checks and inspections.
- Results of inspections, indicating compliance or violations.
- Timestamps and location data for each inspection.
5. Vehicle and Driver Data:
- Data on vehicle types and characteristics.
- Driver profiles and license information.
- Vehicle registration and inspection records.
6. Environmental Conditions:
- Weather conditions that might affect visibility.
- Lighting conditions, especially relevant for nighttime compliance checks.
The steps needed to make the knowledge graph includes defining entities and relationship, data integration, data representation, ontology development, query and analysis, visualization, and continuous monitoring. By following these steps, you can create a robust Knowledge Graph for Traffic Sign Compliance Checking, enabling efficient monitoring, analysis, and improvement of road safety and regulatory compliance. The interconnected nature of the graph allows for a comprehensive understanding of the traffic sign ecosystem and facilitates data-driven decision-making.
Conclusion
Knowledge Graphs have proven to be invaluable assets across diverse industries, providing a holistic view of complex datasets. The examples discussed demonstrate how these graphs enhance decision-making, streamline processes, and contribute to a safer and more efficient future. As industries continue to embrace data-driven technologies, Knowledge Graphs stand at the forefront, unraveling insights that were once hidden in the vast sea of information. The journey towards innovation and efficiency is paved with interconnected knowledge, and Knowledge Graphs are the key to unlocking its full potential.
Category List
- 3D Point Cloud
- Artificial Intelligence
- Asset Management
- Digital Twin
- Featured
- Hardware
- Knowledge Graph
- LiDAR
- News
- Site Monitoring
- Vegetation Monitoring
- Virtual Reality
Recent Post
- Scan-to-BIM Workflow Explained: From LiDAR Point Cloud to BIM Model
- As-Built Drawing Survey Sydney: LiDAR Verification for Construction Projects
- Digital Twin for Construction Projects – How LiDAR Powers Real-Time Site Models
- Road Asset Management Sydney
- Pavement Condition Survey: AI-Powered Road Assessment for Local Councils