Normalized Difference Vegetation Index: Definition, Calculation, Technology
What is Normalized Difference Vegetation Index (NDVI)?
The Normalized Difference Vegetation Index (NDVI) is a key metric used in remote sensing to measure vegetation health and density. NDVI calculates the difference between red band and near-infrared (NIR) light reflected by vegetation. Healthy, green vegetation absorbs visible light and reflects NIR, so areas with high NDVI values indicate healthy, dense vegetation, while low values suggest sparse or stressed vegetation.
How the near-infrared work?
In a healthy plant, the chlorophyll pigment absorbs most of the visible red light. Meanwhile, the cell structure of a plant reflects most of the near-infrared (NIR) light. As a result, if there are many plants with photosynthetic activity, they will have fewer reflectance in the red band and higher reflectance in the NIR. By comparing these value, we can detect and analyze the vegetation cover from one area separately from other type of land cover.
How to Calculate NDVI

- NIR represents the reflectance in the near-infrared spectrum, which healthy vegetation strongly reflects.
- Red represents the reflectance in the red spectrum, which healthy vegetation absorbs.
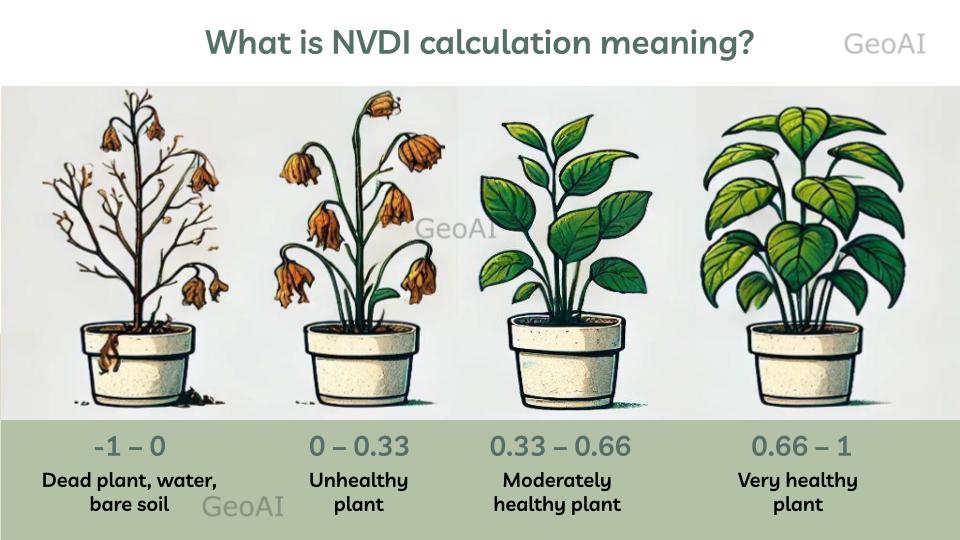
NDVI values range from -1 to +1:
- -1 – 0 : Non-vegetative surfaces, such as water or urban infrastructure.
- 0 – 0.33 : Unhealthy plant or very sparse vegetation
- 0.33 – 0.66 : Moderately healthy plant or sparse vegetation
- 0.66 – 1 : Very healthy plant or dense vegetation
This index provides insights into vegetation health, biomass, and productivity, aiding in agricultural management, forestry, and environmental monitoring.

Technology Used for NDVI Measurement
Several technologies enable the calculation and analysis of NDVI:
- Satellite Imaging: Satellites like Landsat, Sentinel, and MODIS capture visible and NIR images, making them ideal for NDVI calculations over large areas. They provide a broad view, allowing NDVI data to be collected over time for trends and seasonal analyses.
- Drones: Equipped with multispectral or NIR cameras, drones capture high-resolution imagery for detailed NDVI analysis over small areas. Drones are especially useful for monitoring crops, vegetation health in forests, and urban green spaces.
- Handheld Spectrometers: Handheld devices measure the reflectance of specific plant sections, providing on-the-ground NDVI readings. We can use this for spot checks in field research or agriculture.
- IoT Sensors: Networks of Internet of Things (IoT) sensors can measure environmental factors like temperature, soil moisture, and other data to correlate with NDVI. These sensors add real-time, ground-level data for a comprehensive view of vegetation health.
GeoAI and NDVI
GeoAI, or Geospatial Artificial Intelligence, leverages machine learning and AI in analyzing geospatial data like NDVI. We add predictive capabilities and data automation, enabling better, faster insights into vegetation patterns and health. For instance:
- Predictive Analysis: GeoAI can use historical NDVI data to predict future vegetation changes due to climate change, urban expansion, or agricultural practices.
- Anomaly Detection: GeoAI algorithms can identify areas where vegetation health declines unexpectedly, signaling issues like disease, pest infestations, or drought.
- Automated Mapping: GeoAI speeds up mapping and categorization of vegetation health across regions, enabling quicker decisions for land management and conservation.
By integrating NDVI data with GeoAI, researchers and decision-makers gain a powerful tool for understanding and managing vegetation in a dynamic environment.
Category List
- 3D Point Cloud
- Artificial Intelligence
- Asset Management
- Digital Twin
- Featured
- Hardware
- Knowledge Graph
- LiDAR
- News
- Site Monitoring
- Vegetation Monitoring
- Virtual Reality
Recent Post
- Asset Inventory Mapping with GeoAI: Complete Road Asset Capture Using Laser Scanning and Profiling
- Mobile Laser Scanner and Laser Profiler: Dual Approach to Road Surface Condition Surveys
- Edge Pavement Detection: Using LiDAR and AI for Road Asset Management
- What is Digital Surface Model (DSM)?
- Happy New Year 2026 from GeoAI