NDVI Imaging: What It Is and How AI Enhances Its Value
Normalized Difference Vegetation Index (NDVI) imaging is a widely used method to monitor vegetation health and density. It is a crucial tool for agriculture, forestry, and environmental management, providing valuable insights for sustainable decision-making.
What Is NDVI Imaging?
NDVI is a numerical indicator that measures the greenness of vegetation. It compares the reflectance of near-infrared (NIR) and visible light.

Healthy vegetation reflects more NIR light and absorbs visible light. Higher NDVI values indicate healthier and denser vegetation.
How to Get NDVI Data?
- Satellite Data:
- Landsat: Provides multispectral imagery with NIR and red bands for free.
- Sentinel-2: Offers high-resolution multispectral data suitable for NDVI calculation.
- MODIS: Delivers frequent, low-resolution global imagery for large-scale monitoring.
- Drone-Based Data:
- Drones equipped with multispectral cameras capture high-resolution data for local studies.
- The data can be used to capture NIR images and RGB images.
- Field Spectrometers:
- Researchers use handheld devices to measure spectral reflectance in small areas. This device measure the reflectance of specific plant sections to provide on-the-ground NDVI reading.
- This data can be used as ground truth for validation procedure
How to Process NDVI Data?
- Data Collection:
- Obtain raw satellite, drone, or field spectrometer data with NIR and red reflectance bands.
- The source of the data can be from satellite, drone, or field spectrometers
- Preprocessing:
- Correct geometric distortions to align the imagery.
- Apply atmospheric corrections to reduce interference from clouds and aerosols.
- NDVI Calculation:
- Use GIS software or programming tools (e.g., QGIS, ArcGIS, Python) to calculate NDVI using the formula.
- Visualization:
- Generate NDVI maps to visualize vegetation health and distribution.
- Use thresholds to classify vegetation into healthy, stressed, or sparse categories.
- Validation:
- Cross-check NDVI data with field observations to ensure accuracy.
Benefits of NDVI Data
- Agriculture:
- Monitor crop health and detect stress early for precision farming.
- Optimize irrigation and fertilizer use, reducing costs and environmental impact.
- Forestry:
- Assess forest density and detect deforestation or degradation.
- Monitor reforestation projects and natural vegetation recovery.
- Environmental Management:
- Track drought impacts and desertification trends.
- Analyze ecosystem health and biodiversity changes over time.
- Urban Planning:
- Measure green cover in urban areas to support sustainable development.
- Identify heat islands and prioritize greening initiatives.
- Disaster Management:
- Assess vegetation loss after wildfires, floods, or other disasters.
- Plan recovery efforts based on accurate vegetation data.
How AI Enhances NDVI Data Analysis
AI transforms NDVI analysis by making it faster, more accurate, and insightful. Here’s how AI leverages NDVI data:
- Automated Data Processing:
- AI processes large volumes of satellite and drone imagery quickly.
- Deep learning models correct errors and enhance image quality.
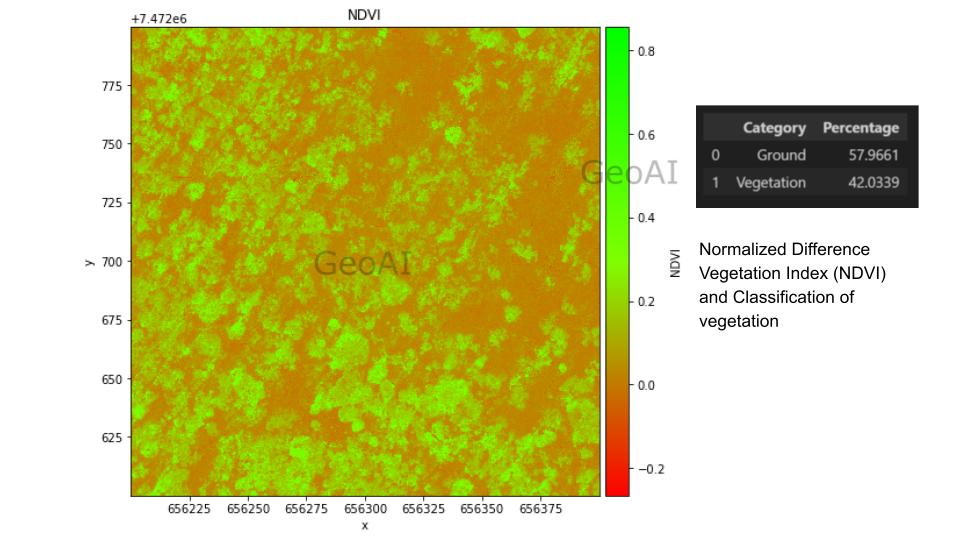
- Deep learning model automatically calculate the crown shape by averaging NDVI in each crown area as a health rating Automatic Normalized Difference Vegetation Index (NDVI) Calculation
 Automatic Normalized Difference Vegetation Index (NDVI) Calculation
- Automatic Calculation of Land Coverage:
- From RGB image, trees, shrubs and grass can be very similar. Normalized difference vegetation index (NDVI) gives more insights on vegetation type and health.
- Using NDVI we can do a rough classification on plant coverage.
- Very low values of NDVI (0.1 and below) correspond to barren areas of rock, sand, or snow. Moderate values represent shrub and grassland (0.2 to 0.3), while high values indicate temperate and tropical rainforests (0.6 to 0.8). Source: nasa

- Automatic Plant Classification
- To automatically classify plants into species, a 3D-CNN model needs to be trained. The training data includes all bands and Canopy height Model we have gained, as well as the tree crown shape file. In addition, we need to label each row with species as ground truth.
- After training, the model is expected to take the same data as input, except species, and output species for each tree ranked on probability
 Automatic Plant Classification
- Predictive Analytics:
- AI predicts vegetation growth patterns based on historical NDVI trends.
- Models estimate crop yields and forest recovery rates.
- Dynamic Monitoring:
- AI-powered systems provide real-time NDVI updates for continuous monitoring.
- Automated alerts inform stakeholders about significant changes in vegetation health.
- Scalable Insights:
- AI extracts actionable insights from regional and global NDVI datasets.
- It supports decision-making for sustainable agriculture, forestry, and conservation.
Why Use AI with NDVI Data?
AI revolutionizes NDVI imaging by unlocking its full potential. It automates complex tasks such as NDVI calculation, automatic land coverage and species classification, predicts outcomes, and delivers actionable insights at unprecedented speed and scale. Combining NDVI with AI provides powerful tools for agriculture, forestry, and environmental management.
Partner with GeoAI to maximize the value of your NDVI data today!
Category List
- 3D Point Cloud
- Artificial Intelligence
- Asset Management
- Digital Twin
- Featured
- Hardware
- Knowledge Graph
- LiDAR
- News
- Site Monitoring
- Vegetation Monitoring
- Virtual Reality
Recent Post
- Asset Inventory Mapping with GeoAI: Complete Road Asset Capture Using Laser Scanning and Profiling
- Mobile Laser Scanner and Laser Profiler: Dual Approach to Road Surface Condition Surveys
- Edge Pavement Detection: Using LiDAR and AI for Road Asset Management
- What is Digital Surface Model (DSM)?
- Happy New Year 2026 from GeoAI