Canopy Height Model (CHM)
Canopy Height Mapping Using 3D LiDAR Point Cloud Data
Canopy Height Model is a critical tool for understanding forest structure and dynamics. By leveraging 3D point cloud data from LiDAR, CHM provides highly accurate measurements of canopy heights and spatial distribution. Below are the key steps for creating a CHM and extracting valuable forest metrics.
Canopy Height Model (CHM) is the height or residual distance between the ground and the top of the of objects above the ground. This includes the actual heights of trees, builds and any other objects on the earth’s surface.
1. From Point Cloud: Separate DSM and DTM
LiDAR point cloud data contains elevation information for both ground and above-ground objects. To prepare for CHM:
- DSM (Digital Surface Model): Extract elevation data representing the top of vegetation and other structures.
- DTM (Digital Terrain Model): Derive the ground elevation by filtering out non-ground points using ground classification algorithms.
- CHM Calculation: Subtract the DTM from the DSM to obtain the canopy height at each point.
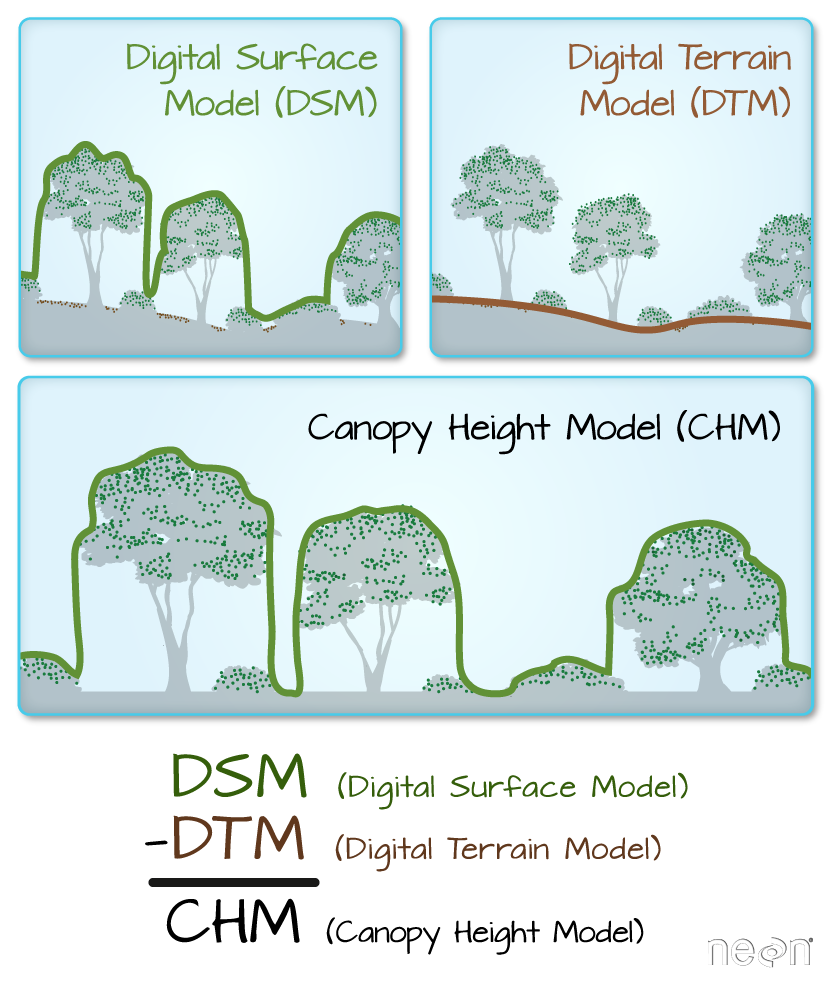
CHM Formula: CHM = DSM – DTM
2. Prepare the Canopy Height Model (CHM)
- Separate DSM and DTM
- Convert the CHM into a raster format for visualization and analysis.
- Perform smoothing to reduce noise and enhance the interpretation of canopy structures.
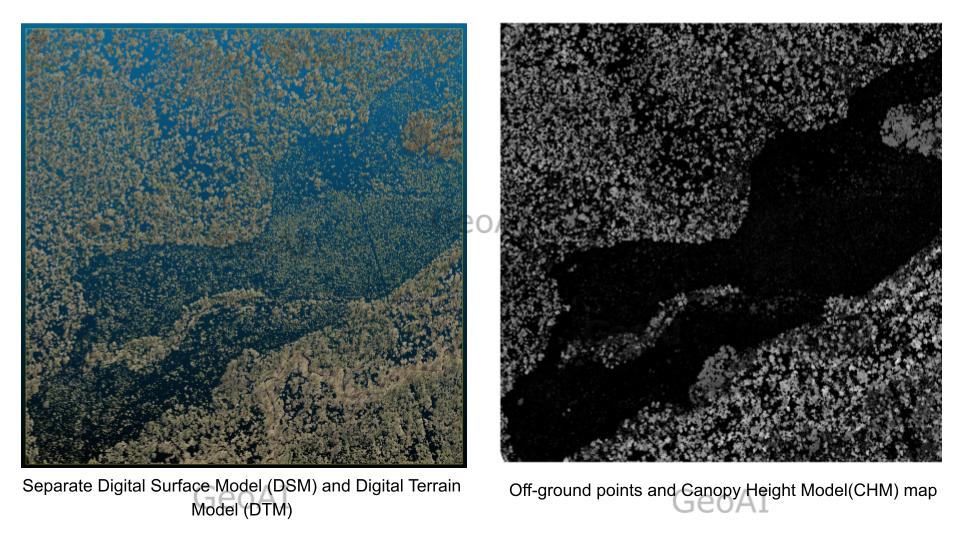
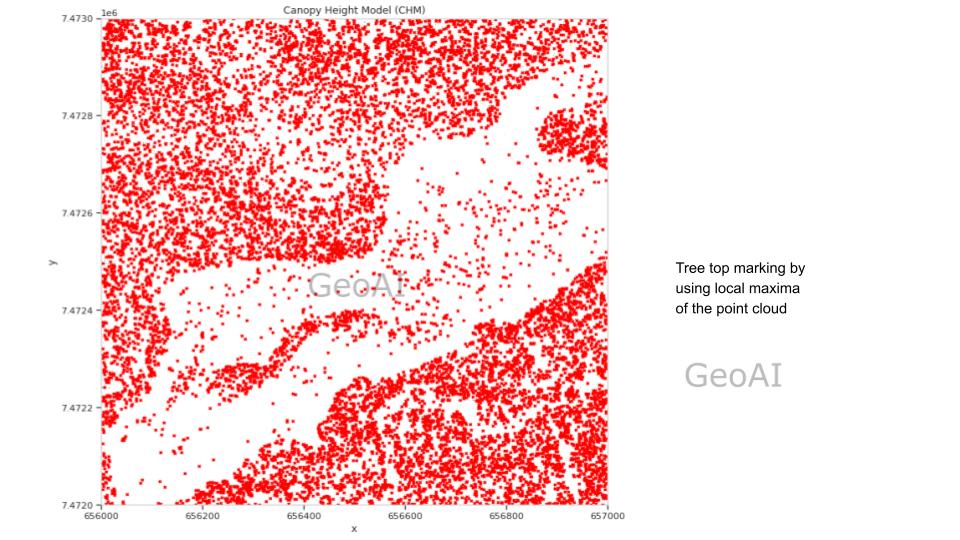
3. From Point Cloud: Mark Each Tree Top by Local Maxima
- Identify Tree Tops: Use a local maxima algorithm to detect the highest points within each canopy.
- Coordinate Mapping: Calculate the geographic coordinates of each tree top. These coordinates can later be matched with field notes for validation.
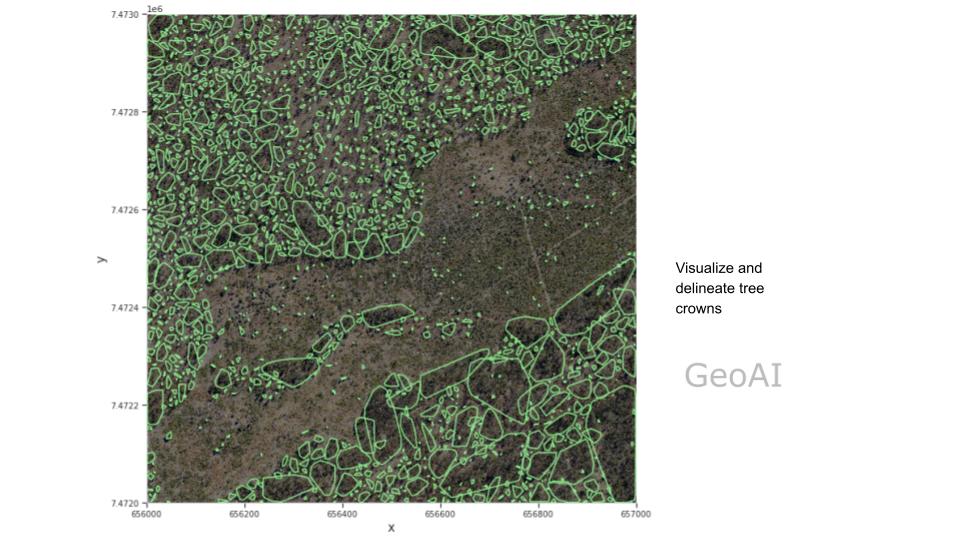
4. From Point Cloud: Visualize and Delineate Tree Crowns
- Tree Crown Delineation: Use density-based spatial clustering to group point cloud data into individual tree crowns.
- Visualization: Display the delineated crowns in 3D to verify the clustering accuracy.
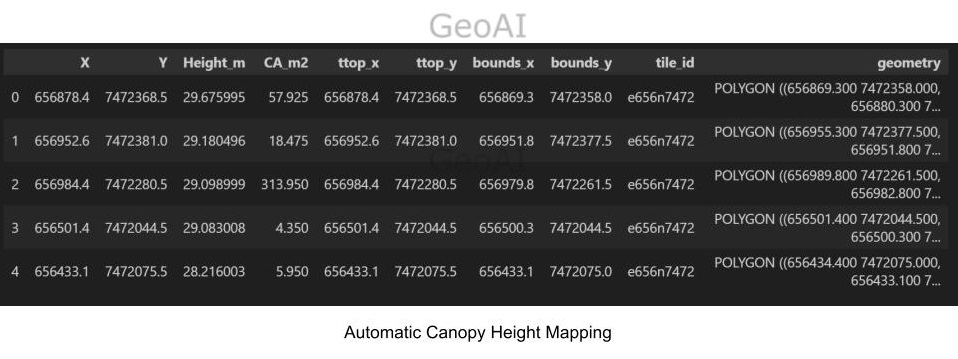
5. From Point Cloud: Generate a Shapefile
- Shapefile Creation: For each delineated crown:
- Save a row in the shapefile with the crown polygon geometry.
- Include the coordinates of the tree/shrub top.
- Calculate and store the crown’s area and height attributes.
- This shapefile can be used for further spatial analysis in GIS platforms.
Applications of Canopy Height Model (CHM)
- Forest Biomass Estimation: Use canopy height to estimate above-ground biomass.
- Biodiversity Assessment: Understand habitat availability and species distribution.
- Forest Health Monitoring: Detect canopy damage from pests, diseases, or storms.
- Carbon Sequestration Studies: Analyze canopy height as a proxy for carbon storage.
By following these steps, CHM enables precise and scalable forest analysis, supporting research and management efforts in ecology, conservation, and forestry.
We’ve successfully helped many companies and government agencies tackle their challenges in these areas by using Artificial Intelligence and Geospatial data. If you have specific questions or need personalized support, feel free to contact us at admin@geoai.au
Category List
- 3D Point Cloud
- Artificial Intelligence
- Asset Management
- Digital Twin
- Featured
- Hardware
- Knowledge Graph
- LiDAR
- News
- Site Monitoring
- Vegetation Monitoring
- Virtual Reality
Recent Post
- Asset Inventory Mapping with GeoAI: Complete Road Asset Capture Using Laser Scanning and Profiling
- Mobile Laser Scanner and Laser Profiler: Dual Approach to Road Surface Condition Surveys
- Edge Pavement Detection: Using LiDAR and AI for Road Asset Management
- What is Digital Surface Model (DSM)?
- Happy New Year 2026 from GeoAI